A Guide to Mastering the TikTok Ads Dashboard
Master the TikTok Ads Dashboard with our complete guide. Learn to navigate the interface, understand key metrics, and use insights to create winning ads.
Welcome to the TikTok Ads Dashboard. If you're new here, it can feel a little intimidating—like stepping into the cockpit of a 747 for the first time. You've got dials, gauges, and menus everywhere. But don't worry. Once you get the lay of the land, you'll see it’s a powerful, and surprisingly intuitive, command center for your brand's advertising.
This is where your strategy gets real. It's where you'll build campaigns, monitor what's working (and what's not), and make the crucial decisions that drive results.
Your Command Center for TikTok Advertising
The entire system is designed around a simple hierarchy: Campaigns contain Ad Groups, and Ad Groups contain Ads. This structure is your friend. It lets you zoom out for a big-picture view of your account's health or zoom in to tweak the performance of a single creative with just a couple of clicks.
To get started, you really only need to focus on three main areas. Everything you do on a day-to-day basis will start from one of these tabs.
The Three Core Navigation Tabs
Getting a handle on these three sections is the key to unlocking the dashboard. Each has a specific job, and together they give you a complete picture of your advertising world.
Here's a quick look at the main areas you'll be working in.
TikTok Ads Dashboard Main Areas at a Glance
This table breaks down the three primary sections you'll be using daily. Understanding what each one is for will help you navigate the platform like a pro from day one.
| Dashboard Section | Primary Function | Key Takeaway |
|---|---|---|
| Dashboard | High-level performance summary | Your morning coffee check-in. See overall spend, conversions, and top-level metrics at a glance. |
| Campaign | Campaign, Ad Group, & Ad management | The "workshop." This is where you build, launch, pause, and edit all your campaigns and creatives. |
| Reporting | In-depth data analysis | The "data lab." Dive deep, create custom reports, and find out why things are performing the way they are. |
Think of these sections as different tools for different jobs. You wouldn't use a microscope to find your car in a parking lot, and you wouldn't use binoculars to examine a cell. Each tab is built for a specific level of detail.
Let's try an analogy. The Dashboard is your car's main display—speed, fuel, engine temp. The Campaign tab is your steering wheel, pedals, and gear shift—the controls you use to actually drive. And the Reporting tab? That's the full diagnostic report your mechanic runs to see exactly what's happening under the hood.
This setup makes your workflow logical and efficient. For instance, you might spot a trend in the Reporting tab—say, one ad creative is outperforming all others by 2x. You can then jump right over to the Campaign tab to allocate more budget to it.
And if your data shows you need fresh creative ideas, you can use those insights to guide your next move. For generating new, high-performing video concepts quickly, a tool like ShortGenius can be a lifesaver, helping you turn data into winning ads. Our goal is to get you comfortable moving from simply looking at data to making smart, confident decisions that grow your business.
Getting Around the TikTok Ads Manager Interface
Think of the TikTok Ads Manager as the command center for all your advertising. At first, it might seem like a lot to take in, but it’s built on a simple, powerful three-level structure: Campaigns, Ad Groups, and Ads. Getting this hierarchy straight is the absolute first step to building ad accounts that are easy to manage and scale.
Each level has its own job. The Campaign is the highest level, and it’s where you set your main goal—are you trying to get website conversions, or maybe generate new leads? Below that, you have Ad Groups, which are like folders where you control your budget, who you’re targeting, and where your ads will show up. Finally, at the bottom, you have the Ads themselves. This is where your videos and images, the actual creative your audience sees, are housed.
This layered approach is brilliant because it lets you test things methodically. For instance, you could have one campaign with two different ad groups targeting two completely different audiences, but using the exact same set of ads. This clean setup immediately tells you which audience is more responsive without muddying your data.
The Ad Hierarchy You Need to Know
Once you master this structure, you’ll avoid the messy, confusing ad accounts that plague so many beginners. It makes figuring out what’s going on so much easier. When you can isolate variables at each level, you can pinpoint exactly what’s working and what isn’t.
Here’s a simple visual to show you how it all fits together inside the dashboard.
This diagram shows the logical flow, from the big-picture Campaign objective all the way down to the individual creatives. Each layer gives you a different set of controls for your advertising.
Besides the campaign structure, the Assets library is your other go-to spot. It's basically your media hub where you can manage all the pieces you need to run your ads.
- Creatives: This is where every video and image you've uploaded lives.
- Audiences: Here, you'll build and manage your custom audiences (like people who visited your site) and lookalike audiences.
- Pixels: Need to check the status of your TikTok Pixel? You can manage it from here.
Finding What You Need, Fast
The TikTok Ads Dashboard is packed with data, but a few key features help you cut right through the noise. I see so many newcomers overlook incredibly useful tools like the advanced filters, column customization, and the date range selector. These aren't just little conveniences; they are absolutely essential for doing proper analysis.
By customizing your columns, you can create a personalized view that surfaces the metrics that actually matter for your goals. Instead of scrolling through dozens of data points you don't care about, you can build a clean interface that shows you only what you need to make fast, smart decisions.
For a performance marketer, this is huge. It means setting up a view that puts CTR (Click-Through Rate), CPC (Cost Per Click), and CPA (Cost Per Acquisition) right next to each other. This lets you quickly compare different ads within an ad group to see which creative is driving the most efficient results.
This kind of detailed analysis is more important than ever, especially with the platform's user base constantly evolving. A quick look at the TikTok Ads Dashboard reveals demographic shifts that smart advertisers are already acting on. While total ad reach hit an incredible 1.59-1.67 billion monthly actives in early 2025—and is projected to climb to 1.9 billion by 2029—the audience is getting older. We’re seeing a huge surge in the 25-44 segment, which is a goldmine for performance marketers targeting millennials. You can dive deeper into these demographic shifts and what they mean for advertisers by checking out the latest TikTok Ads statistics.
Turning Ad Metrics Into Real-World Insights

Let's be honest, a dashboard full of acronyms can feel like alphabet soup. Metrics are the language your campaign uses to tell you how it's doing, but just reading the numbers isn't enough. The real magic happens when you understand how those numbers relate to each other. This is how you turn raw data from the TikTok ads dashboard into decisions that actually make you money.
Think of your ad performance as a story that unfolds in three acts, just like the customer's journey. By breaking it down this way, you can pinpoint exactly where your strategy is winning and where it's falling flat.
Act 1: Awareness - Did They Even See You?
This first stage is all about getting on the radar. Are people seeing your ads? Are you capturing their attention, even for a split second?
- Impressions: This is simply the total number of times your ad was shown on a screen. It’s a raw measure of your campaign's visibility.
- Reach: This tells you how many unique people saw your ad. If one person sees your ad three times, that's 3 impressions but only a reach of 1.
- CPM (Cost Per 1,000 Impressions): This is the price you pay for a thousand ad views. If your CPM starts creeping up, it can be a warning sign that your audience is getting tired of your creative (ad fatigue) or that more competitors are bidding for the same eyeballs.
These metrics tell you if you're even in the game. If you're seeing low impressions, your budget might be too small or your targeting too narrow to make a splash. A high CPM? It might be time to swap in a fresh creative to keep things from getting stale.
Act 2: Consideration - Did You Stop the Scroll?
Okay, so they saw you. But did they care? Consideration metrics tell you how well your creative is doing its main job: making someone pause their endless scrolling and engage.
Your ad’s one and only job on TikTok is to stop the scroll. That's it. If your awareness numbers look great but nobody is interacting, you've got a creative problem, not a budget problem.
Here are the key metrics for this stage:
- Clicks (All): This counts every single click on your ad—tapping your profile picture, the music credit, a hashtag, you name it.
- CTR (Click-Through Rate): This is the percentage of people who saw your ad and then clicked on it. A healthy CTR is a great sign that your ad is relevant and hitting the right notes with your audience.
- CPC (Cost Per Click): This is the average price you're paying for each of those clicks. It's a quick way to gauge how efficiently you're driving traffic.
A ton of impressions but a dismal CTR is a classic sign that your ad is being ignored. The TikTok ads dashboard is basically screaming at you to test new hooks. Is the first three seconds of your video compelling enough to make someone curious? Probably not.
Act 3: Conversion - Did They Do the Thing?
This is the moment of truth. After all that work to get them to click, did they actually do what you wanted them to do? This is where your campaign proves its worth and you see a real return on your investment.
Conversion metrics are your bottom line. They're the numbers that really matter.
| Metric | What It Measures | Why It Matters |
|---|---|---|
| Conversions | The total number of times your desired action was completed (e.g., a purchase, a sign-up). | This is your ultimate goal. It's the most direct measure of your campaign's success. |
| CVR (Conversion Rate) | The percentage of clicks that turned into a conversion. | A high CVR shows that your landing page is effective and you're sending the right people to it. |
| CPA (Cost Per Action) | The average amount of money it costs you to get one conversion. | This tells you if you're profitable. Your CPA has to be lower than what a customer is worth to your business. |
A very common mistake is getting excited about a high CTR without checking the CVR. A high CTR paired with a low CVR points to a major disconnect. Your ad is making a promise that your landing page isn't delivering on. That's a golden optimization opportunity, telling you to align your ad's message and vibe with the post-click experience. Once you start seeing these relationships, you're no longer just reading metrics—you're using them to build smarter, more profitable campaigns.
Building Powerful Custom Reports
The standard view in your TikTok Ads Dashboard is a great starting point. It gives you a solid, high-level overview. But think of it like a map that only shows the major highways—to really know the terrain, you need the backroads and side streets. That’s where custom reports come in.
Building your own reports is how you move beyond surface-level stats and start asking specific, strategic questions about your campaigns. It allows you to zero in on the key performance indicators (KPIs) that actually matter to your business, not just the default ones TikTok thinks you should see. This focus helps you make smarter decisions about your budget, creative, and overall marketing strategy.
Creating Your Own Metrics with Custom Columns
The "Custom Columns" feature is probably the most powerful, and underutilized, tool in the entire dashboard. It’s your secret weapon for digging deeper. It lets you create brand-new metrics by combining existing ones with simple formulas, turning your dashboard from a simple reporting tool into a true command center.
Instead of exporting everything to a spreadsheet to calculate important ratios, you can build them right into your view. This is a huge time-saver and, more importantly, it ensures everyone on your team is looking at the exact same data, calculated the same way, every time.
Here are a few custom columns I build for almost every account:
- Cost per Add to Cart: If you’re in e-commerce, your CPA is the north star. But what about the steps before the purchase? This metric helps you pinpoint exactly where friction exists between someone clicking your ad and actually buying.
- Video View Rate at 75%: This tells you what percentage of people who started your video made it three-quarters of the way through. It's a fantastic proxy for how engaging your creative is after the initial hook.
- Hook Rate (3-Second View Rate): Here, you calculate the percentage of impressions that turned into a 3-second view. This metric is all about the first few seconds of your ad—it tells you, point-blank, if you’re stopping the scroll.
Building and Saving Report Templates
Once you’ve figured out which metrics truly move the needle for your business, you can bundle them together and save them as report templates. This is absolutely essential for creating an efficient analysis workflow. You wouldn't use the same toolkit to build a house that you'd use to fix a car, right? The same logic applies here—you need different reports for different jobs.
For instance, I recommend setting up at least two distinct templates:
- Creative Performance Report: This view is all about the ad itself. You’d load it up with columns like CTR, Hook Rate, Video Completion Rate, and Cost Per Click (CPC). The goal is to quickly see which ads are grabbing attention and which are falling flat.
- Funnel Analysis Report: This template follows the money. You’d track the customer journey with metrics like Cost per Landing Page View, Cost per Add to Cart, and Purchase ROAS (Return On Ad Spend). This report shows you where users are dropping off and how profitable each campaign really is.
Think of these templates as custom-built lenses. One lens helps you see the creative quality and immediate impact of your ads. The other shows you the financial health and efficiency of your entire sales funnel.
This level of granular reporting is crucial when you're playing on a platform of this scale. For context, the TikTok Ads Dashboard reported a potential ad reach of 1.59 billion users in early 2025. That’s a staggering 28.6% of all internet users on the planet. With an audience that massive, precise, custom-built reports are the only way to navigate effectively and find your people. You can learn more about TikTok's growing advertising landscape to really grasp the scale of the opportunity.
Automating Your Reporting Workflow
Finally, once your custom reports are dialed in, you can schedule them to be automatically generated and emailed to your team or clients. This is a game-changer. It keeps key stakeholders in the loop without them ever needing to log into the ads manager.
You can set up daily, weekly, or monthly sends to keep everyone aligned on performance. It turns your dashboard from a reactive tool you have to check into a proactive communication engine that keeps the strategy moving forward.
Connecting Dashboard Data to Creative Strategy
Your TikTok Ads Dashboard is so much more than a rearview mirror showing you what happened last week. Think of it as a treasure map, with every metric and chart pointing directly to your next winning creative. This is where the numbers game stops being abstract and starts driving real-world creative decisions, turning your ad strategy from a guessing game into a data-fueled system.
The best advertisers on TikTok all have one thing in common: they operate in a constant feedback loop. They launch ads, obsessively watch the data, figure out what's working (and what's not), and immediately pour those insights back into the next round of videos. This transforms your dashboard from a simple reporting tool into an engine for relentless improvement.
From Diagnosis to Creative Brief
The real skill is learning to read the story your metrics are telling. For example, seeing a high 2-second view rate but a massive drop-off before the 6-second mark is a classic tell. It means your initial visual was strong enough to stop the scroll, but the hook or story just didn't hold their attention.
That single insight is gold. It gives your creative team a crystal-clear directive: the concept is fine, but the opening is the problem. Instead of starting from scratch, the next move is to test a handful of new hooks against the same core video.
Your dashboard doesn't just tell you what happened; it whispers clues as to why. A climbing CPM and a tanking CTR aren't just numbers on a screen—they're the vital signs of ad fatigue. It's the dashboard's way of screaming, "Refresh this creative before it's too late!"
This is all about translating cold, hard data into a tangible creative brief. If you spot ad fatigue, you don't just tell your team to "make a new ad." You get specific:
- Rework the first 3 seconds: Test a completely different opening shot or scene.
- Switch up the voiceover: Try a new tone, maybe a different gender, or a more energetic delivery.
- Rewrite the on-screen text: Test a direct call-to-action against a question-based hook.
Building a Continuous Feedback Loop
When you start working this way, every new ad you make has a statistically better chance of succeeding than the last. You stop throwing spaghetti at the wall and start making calculated, strategic moves based on how real people are actually behaving.
Here's a simple way to visualize the reporting process that keeps this feedback loop humming.
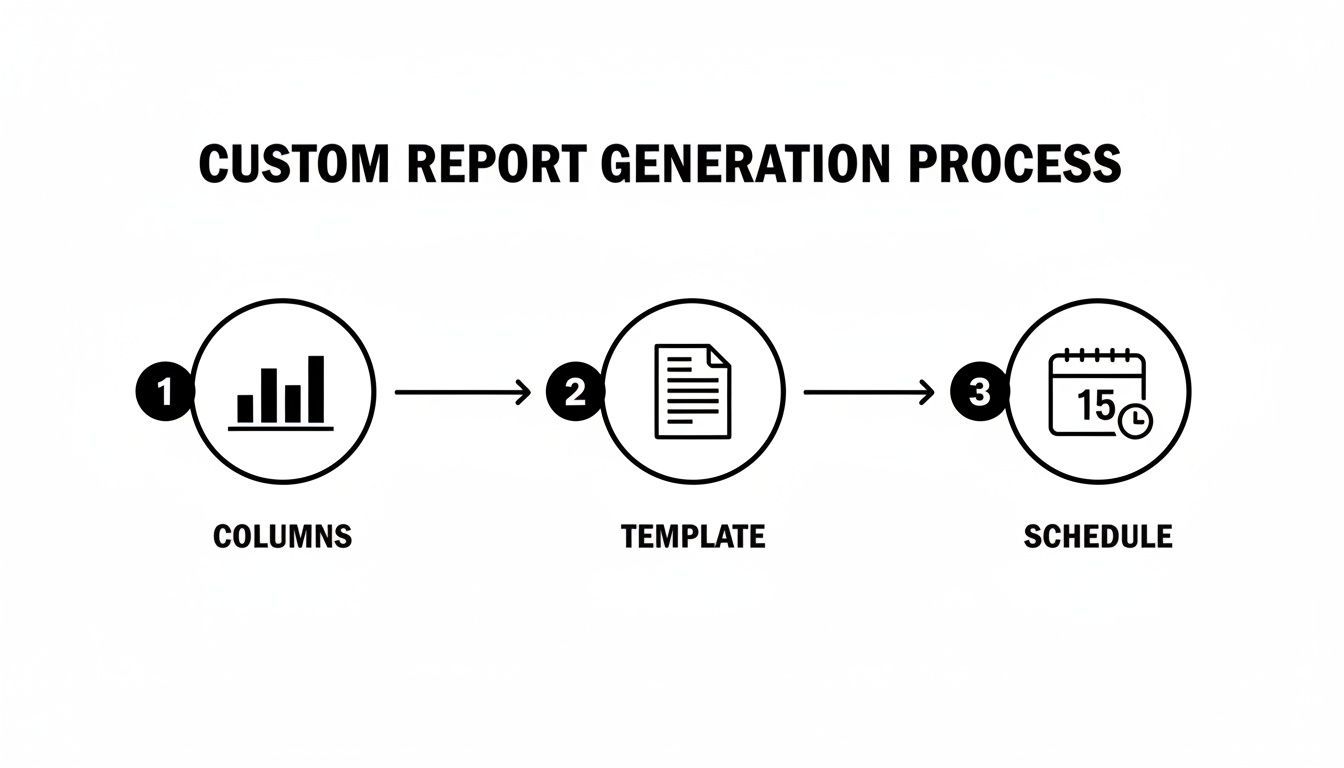
This workflow is deceptively powerful. By defining your key columns, saving it as a template, and scheduling the report, you guarantee you're getting the exact data you need, right when you need it, to make these critical creative calls.
This is also where you can connect your dashboard insights directly to the production pipeline. A tool like ShortGenius can put this whole cycle on hyperdrive. Instead of starting from a blank page, you can take a winning ad, generate a dozen new script variations, and create multiple versions with different hooks or voiceovers in minutes. It lets you test the hypotheses your dashboard is giving you at a scale and speed that just wasn't possible before.
Expanding Your Creative Perspective
Beyond your own ad metrics, keeping a pulse on what’s happening organically on the platform can give you a huge creative edge. Using tools that let you see what’s trending in organic content, like a Tiktok Story Viewer, helps you spot new formats and styles before they become saturated. This can spark ideas for new creative approaches that feel more native and less like an ad, making your data-driven optimizations even more effective.
Let's walk through what this feedback loop looks like in the real world:
- Launch: You push a campaign live with three different ads for a new product.
- Analyze: You jump into the TikTok Ads Dashboard and see Ad B has a 50% higher CTR than the others. But you also notice Ad C has a 20% better 6-second view rate.
- Identify: The diagnosis is clear. Ad B has a killer call-to-action, but Ad C has a much stronger, more engaging hook.
- Iterate: The next creative brief writes itself: "Let's combine the first three seconds of Ad C with the final five seconds of Ad B."
By following this simple process, you're essentially kit-bashing your best-performing ad elements to create a new "super ad" with a much higher probability of success. This disciplined, data-first approach is what turns your dashboard from a reporting tool into the most valuable part of your entire creative strategy.
Troubleshooting Common Tracking Issues
It’s one of the most frustrating feelings for any advertiser: you glance at your TikTok Ads dashboard, look at your Shopify numbers, and the two just don't match. When TikTok reports a flood of conversions that your store's backend can't confirm, you start to question everything. It feels like you’re flying blind.
But take a deep breath. These kinds of tracking problems are incredibly common, and thankfully, they usually have a logical explanation and a clear fix.
Think of your TikTok Pixel as a little messenger sprinting back and forth between your website and your ad account. If that messenger gets sidetracked, delivers a garbled message, or shows up late, your data gets messy. Our job is to pinpoint where that communication is breaking down. It almost always comes down to one of three things: the pixel setup itself, the way different platforms count a "conversion," or a hiccup in your ad delivery settings.
Diagnosing Pixel and Event Discrepancies
The classic problem is a mismatch in conversion data. You might see TikTok proudly reporting 50 purchases, while your e-commerce platform insists there were only 40. This kind of 10-20% difference is often completely normal, and it's rooted in how each platform attributes a sale back to your ad.
For instance, TikTok might take credit for a sale if someone saw your ad, scrolled past, but then remembered your brand and came back to your site to buy something later that day. That's a "view-through" conversion. Meanwhile, Google Analytics, by default, would probably give that credit to a different source, like organic search or direct traffic.
Ready to play detective? Start with this simple checklist:
- Get the TikTok Pixel Helper: This free Chrome extension is non-negotiable. Seriously, install it now. Go to your key website pages—product pages, cart, checkout—and let the extension tell you if your pixel is firing correctly for events like
ViewContent,AddToCart, andCompletePayment. - Check Your Events Manager: Head into your TikTok Ads Dashboard and go to Assets > Events. This section gives you a live feed of all the data your pixel is sending back. If you’re clicking around your site and don't see those actions pop up here in real-time, you’ve got an installation problem.
- Review Your Attribution Window: Every campaign has an attribution setting (e.g., 7-day click, 1-day view). This setting tells TikTok how long it has to claim credit for a conversion after someone interacts with your ad. Make sure this window makes sense for how long it typically takes your customers to decide to buy.
A common pitfall is forgetting that different platforms have entirely different rulebooks for attribution. TikTok wants to take credit for conversions it influenced, while other platforms may only care about the very last click. Neither is "wrong," they're just measuring with different yardsticks.
Solving Ad Delivery Problems
Sometimes the problem isn't your tracking at all—it’s your ads. You have a campaign that’s been approved, but it’s getting zero impressions. It's a head-scratcher, for sure, but the cause is usually a setting that's just a little too tight.
If your ad budget isn't spending, check these usual suspects:
- Audience Size Too Small: If you've layered on so many targeting options that your audience is super niche, TikTok's algorithm might just struggle to find enough people to show your ad to. Look for an audience size that the platform labels "Fairly Broad" or "Balanced."
- Your Bid Is Too Low: Are you using a manual bidding strategy? You might be getting outbid in the auction. If you're not sure what you're doing, a great starting point is to switch to the "Lowest Cost" bid strategy and let TikTok's algorithm handle it for you.
- Creative Is Stuck in Review: It happens. An ad can sometimes get stuck in limbo. If it’s been more than 24 hours and you see no movement, try re-uploading the ad or reaching out to support.
By systematically running through these checks, you can solve the vast majority of tracking and delivery issues you'll run into. It’s all about creating a process. This proactive approach keeps your data clean and trustworthy, so you can make confident decisions to scale your campaigns.
Your Top Questions, Answered
Alright, let's dive into some of the questions that pop up most often when you're in the trenches, managing your TikTok campaigns. Moving from knowing what a button does to actually using it day-to-day always brings up new challenges, so we've put together some straight answers to clear things up.
These are the common head-scratchers we see from new and even seasoned marketers. The goal here is to give you quick, practical solutions so you can spend less time wondering and more time optimizing.
How Often Should I Be Checking My TikTok Ads Dashboard?
If a campaign is live and spending your money, you should be peeking at it daily. Seriously. A quick 15-minute check-in each morning is all you need to get a feel for the vital signs: ad spend, pacing, and overall performance. This simple habit is your early warning system, helping you spot a runaway CPA or an ad that's mysteriously stopped delivering before it can do real damage to your budget.
Beyond that daily pulse check, set aside time for a more in-depth weekly review. This is where the real strategy happens. You'll want to zoom out and look for trends, see how different creatives are performing against each other, and make the big calls: which campaigns get more budget, which ones get paused, and what new ideas are worth testing next week.
What's the Real Difference Between the 'Dashboard' and 'Reporting' Tabs?
Think of it like this: the main Dashboard is your car's dashboard. It gives you the immediate, high-level info you need to operate safely—your speed, your fuel level, any warning lights. It's built for quick glances, showing top-line stats like total spend, conversions, and CPC across everything that's currently running. It's your "is everything okay?" screen.
The Reporting tab, however, is the full diagnostic report from the mechanic. It’s a far more powerful tool designed for deep-dive analysis. Here, you can build custom reports from the ground up, slicing and dicing your data by dimensions like ad placement, audience demographics, or even the name of your creative. It’s where you go to figure out why your performance looks the way it does.
The Dashboard tells you what's happening right now. The Reporting tab helps you understand why it's happening over time.
Help! Why Don't My Dashboard Conversions Match My Website Analytics?
This is probably the most common source of confusion, and the answer almost always comes down to one thing: attribution models. Your TikTok Ads Dashboard and your website analytics (like Google Analytics) are speaking two different languages when it comes to giving credit for a conversion.
TikTok operates on its own attribution window (for example, a 7-day click and 1-day view window is common), while your analytics platform is likely using a different model, such as last-click.
Here’s what that means in practice:
- TikTok often counts view-through conversions, meaning someone saw your ad, didn't click, but came back to your site and converted later. TikTok takes credit; Google Analytics likely won't.
- Website analytics usually give credit to the very last touchpoint. If someone saw your TikTok ad, but later Googled your brand and clicked that link to buy, Google gets all the credit.
- Other culprits can include cross-device tracking issues, pesky ad blockers, and the ongoing impact of iOS privacy updates.
To start troubleshooting, grab the TikTok Pixel Helper browser extension. It’s a lifesaver for making sure your pixel is firing correctly and that all your conversion events are properly configured in the Events Manager.
What Is a "Good" Cost Per Acquisition on TikTok?
Honestly, there's no magic number. A "good" Cost Per Acquisition (CPA) is completely relative to your own business, your product's price, and your profit margins. A $50 CPA might be a massive win for someone selling a $500 mattress, but it would be a complete disaster for a brand selling a $40 t-shirt.
Instead of getting hung up on industry benchmarks, shift your focus to your Return On Ad Spend (ROAS). That's the metric that truly matters. As long as your CPA is low enough to keep your ROAS profitable, you're on the right path. Use the dashboard to see how your CPA trends over time and, more importantly, to pinpoint which creatives and audiences are actually making you money.
Ready to turn those dashboard insights into winning ads—without the guesswork? ShortGenius uses AI to help you generate endless ad variations, scripts, and hooks based on what your data is telling you works. It’s the fastest way to go from insight to creation. Generate your next high-performing ad with ShortGenius.